Blogs
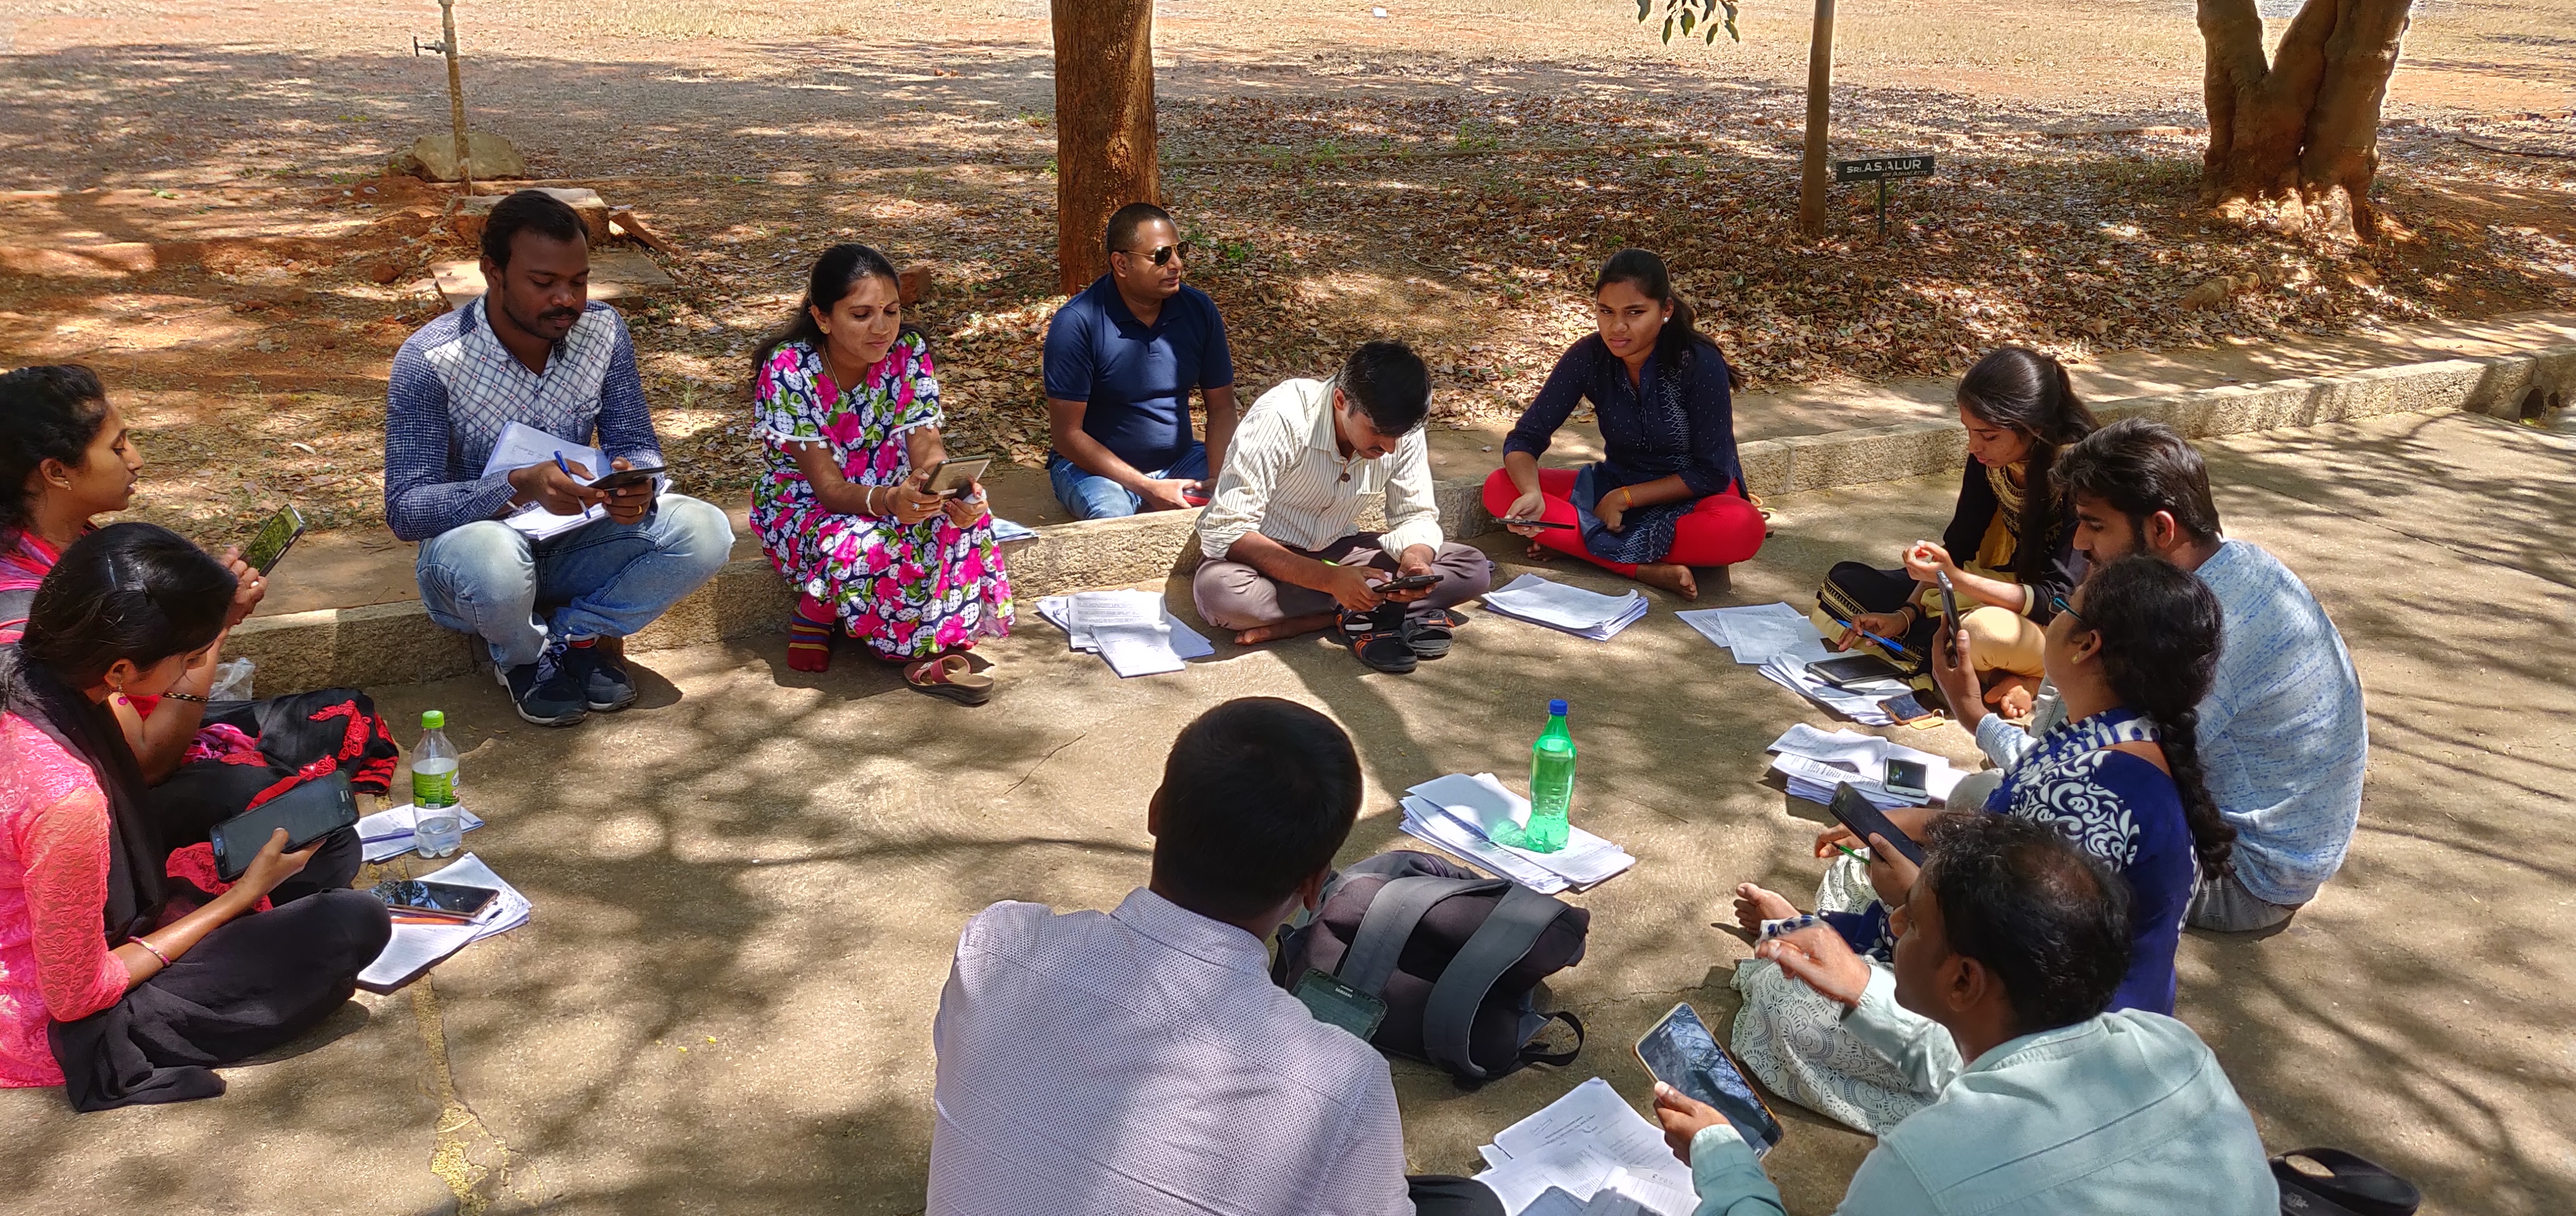
HOW TO CONDUCT BACK-CHECKS
Backchecks are quality control measures undertaken to corroborate the credibility and the legitimacy of data collected from a survey. Back-checks necessitate the installation of a back-check team. This team holds responsibility for a re-evaluation of survey outcomes by returning to a randomly selected subset of households from where the data had originally been collected. These randomly selected households are re-interviewed using a back-check survey. The back-check survey contains a subset of questions from the original survey.
Why are back-checks conducted?
Back-checks help to legitimize the data collected from a survey. They act as a tool to assess the enumerator’s effectiveness in conducting a survey and drawing outcomes from the same, help detect discrepancy, if any, in survey outcomes and help in identifying malfunctioning and obsolete survey tools and under-equipped enumerators.
How are back-checks conducted?
The following steps are to be undertaken for the purpose of back-checking a survey.
Coordinating and sampling for back-checks:
The back-checks are conducted by a back-check team which involves enumerators of sound credibility and immaculate character to safeguard against biases and errors.
The duration of back-check surveys should ideally be 10-15 minutes.
20% of the back-checks should be conducted within two weeks from the commencement of fieldwork. This will ensure that the operativeness of the questionnaire and the effectiveness of the enumerators are communicated to the researchers in time, helping them regulate the means to gather high-quality data.
10-20% of the total observations should ideally be back-checked. Missing respondents should be included in the back-check sample.
Designing back-check surveys:
 Outlineindia
- 12 October, 2023
DATA CLEANING SERIES: AN INTRODUCTION TO DATA CLEANING
Data cleaning bridges the gap between data capture and data analysis. Even though data cleaning remains skill that is rarely taught, and almost always picked up on the job, its importance in research studies is unquestionable. When data informs policies that affect lives, it is imperative that that data be reliable, accurate, and precise. “Data cleaners” work precisely on this. Here, we try to give you an insight into why data cleaning is essential, what it is, how we go about cleaning data and a few tips and tricks that we picked up on the way.
Why data cleaning is important
Imagine trying to cook something delicious with spoiled ingredients. That is how data analysis would be with a dataset, which is unclean. If we had a nickel for every time that we hear of policies being based on unreliable data, we would not need to work a day of our lives. As development practitioners, we understand that the stakes are high when policies are informed by shoddy data. Dirty data would churn out erroneous results, compromise the effectiveness of policies and programmes, cause wastage of resources. Data cleaning can avoid this chain of events, ensure that policies have a real impact and that lives do change.
What is data cleaning?
To get reliable and accurate results from a dataset, that data set must be of the best quality, because as they say – “garbage in; garbage out”. Data cleaning is the process of making sure that the quality of your data is top-notch. This may mean several things, depending on the specific dataset you are dealing with. However, there are a few general guidelines that may be followed.
Data cleaning essentially starts from identifying the issues that your dataset may be suffering with. For instance, if you are collecting information on the reproductive health of adolescent girls, you would not want your dataset throwing up information on the reproductive health of women in their thirties. To streamline this discovery of errors, something we learned early on from various resources was this: The data must be relevant, valid, accurate, complete, consistent, and uniform. These terms are illustrated below with relevant examples.
Relevance: Make sure the dataset meets the purpose of the study. A study concerning the impact of skill development programme on girls renders data collected on its effects on boys irrelevant.
Validity: The entries in each cell must be valid, and adhere to constraints imposed. For example, when recording the height of a respondent, the entry must not be negative or an outlier (for example 50 feet). Similarly, age, number of assets, number of family members, etc. must not be negative. Text fields must not have numbers and vice-versa. Make sure to figure out the validity constraints of each of the columns of your dataset, and check for any invalid entries. For example, some questions may be mandatory, and the recorded response must not be empty. Another validity constraint could be on the range of responses that can be entered (gender can only be male or female, age may be constrained to 18-65 years, etc.)
Accuracy: The data collected must be as close to the true value as possible. This could be as simple as looking at phone numbers. See if any of them start with an area code of a whole other region, check to see if it is something like 9999999999. This exercise could be a little bit more complicated too. Say a survey asks the number of children for a female over 14 years of age. For a 14-year-old girl, the record says she has four children. This information is potentially inaccurate and necessitates investigation into whether there was an error at the time of data entry or in the respondent’s understanding of the question.
Completeness: While missing information is a common malady that plagues data, it is crucial to find out what is missing. Missing information may lead to misleading results. For example in a study of contraception practices, the prevalence of sexually transmitted diseases is a vital variable. If this variable has a high number of “Refused to answer” or “Don’t Knows”, the study will not be able to communicate much. In such cases, the best practice is to go back to the field and re-interview the respondents, if that is possible. The best way is to reach out to the respective respondent and interview them again. Moreover, do check that the number of variables and the number of observations in the dataset is correct.
Consistency: Look out for inconsistent entries. For example, it seems a bit fishy if a respondent’s age is 65 years, but the day of his/her marriage is two years ago. Also, it is essential to check that all the skips in the questionnaire are correctly coded.
Uniformity: The data for each variable, that is, in each column, must be of the same unit. This is to say that if aquestion records the age of a child in days, the age of each child in the dataset must be in days - none in years or months. If Panchayat is a variable in your dataset, make sure you are using standardised names for them, and other such variables. You must translate all text fields to the same language, and change the case of all text fields to match.
These data cleaning checks are generic and can be further customised for any dataset. However, before anything else, it is crucial that you are familiar with the survey tool, inside and out. Understand its purpose, its flow, the skips, the number of variables, the units of variables, etc. Once that is done, the data cleaning protocol will become much easier, and may seem to be developing on its own! This is to say that once you are thorough with your survey tool, you will be able to intuitively know what to look for in a dataset while cleaning, instead of having to refer to a list of checks. We will discuss a few specific ways of performing data cleaning in the second article of the series.
 Outlineindia
- 12 October, 2023
DATA CLEANING SERIES: A GUIDE TO DATA CLEANING
Data cleaning is about understanding the data at hand as well as the expanse of the study under consideration. Data cleaning is a simple exercise when done using proper methods and planning. It is vital to start from the basics and build your way up.
Things to Remember
The first and foremost thing to keep in mind when working with multiple datasets or multiple copies of the same dataset is the name assignment on files. It is easy to get swamped by the sea of complicated and huge master databases. The approach that we follow is to note down not only the date of creation of the file but also the number of data points contained in it. This is especially useful in case the data needs to be split up for any reason. For more clarity, save your files in dated folders to keep track of your daily work.
It is also imperative to keep a tab on the number of observations in the database. Hence a rule of thumb to be followed when dealing with data is that count is of utmost importance! (Also always subtract 1 (for the first row with variable names) from the count of observations in a single column generated in excel, unless you want to spend 20 minutes trying to find the missing data!)
Every beginner in the world of data cleaning wonders what tool would be the best for data cleaning. From experience, we realised that Stata, R, and Excel are capable of performing the basic checks discussed in this article. Ultimately, the choice of the tool depends on how comfortable you are with it and how accessible it is.
The aforementioned points should be kept in mind while dealing with any kind of data and can make the data cleaning exercise more efficient and straightforward.
Things to look out for
Almost all primary datasets have a unique identifier attached to each observation. This can either be a unique ID or the name of the respondent or another related variable. These are key variables for the examination and analysis of the data since the information that we want to understand is contained at the unit data level. However, duplicity is an issue faced when dealing with household level data. The duplication signifies either multiple visits to the same household or input of the wrong ID for different households.
A two-step approach should be followed to make corrections for duplicates:
Step 1: Identification
We need to first identify the duplicate values in the database. The unique identifier is the key variable to be used for this purpose. Finding duplicates of numeric or alpha-numeric IDs can be done using simple commands on STATA (the duplicates command) or in Excel (highlight duplicates function). It is possible that a revisit has been made to the same household due to lack of availability on the first visit (a consent no will be recorded for such a survey). In this case, this input is not a duplicate and may be controlled for during the analysis.
Using the respondent name as an identifier comes with some caveats. An obvious issue is that two or more people can have the same name. In this case, the survey entries should be compared to ascertain if duplicate values have been recorded or not. It is advisable to compare more than one variable to check for duplicity. Key variables to be compared are personal details like address, age, education level, marital status, and so on that are furnished by the respondent.
Step 2: Rectification
Having identified the duplicate values in the database, a decision needs to be taken to keep one of the multiple recordings. Complete surveys containing information about the vital parameters for the study should always have precedence over the alternative entries or incomplete entries.
After completing the aforementioned steps, the new dataset will contain unique observations, and any further cleaning of the database has to be carried out after removing the duplicate values.
An efficient way to study the dataset is to observe it column-wise. It is imperative to have knowledge of which question of the survey tool the variable represents, and any relevant validity constraints.
The next thing to look out for is typing errors in the dataset. These can exist in entry fields for names, addresses or numeric entries for multiple choice questions. For example, a “don’t know” response can be coded as “999” but the response entry may contain “99” or “9” instead. Skimming through the observations in the filter set for the particular column in Excel is an easy approach to spot typing errors in the dataset. Another approach is using the tabulate command in STATA. This command will generate a table that will list out all the recorded entries and the corresponding frequencies of a particular variable. Typing errors may be spotted in this list.
Another issue that can come up is erroneous negative numeric data entries. They can be identified by using the methodology delineated above for typing errors. For example, calculated fields such as total spending or earning can have negative numbers that must be flagged. These fields are automatically calculated from responses given in the survey. Say, we ask the respondent the number of days they worked in the last month, and their average daily earnings. The survey platform automatically calculates total earnings by multiplying the number of days worked with average daily earnings for each respondent. However, sometimes a respondent may not remember or may not want to answer these questions. In such cases, if “Do not remember” has been coded in as -777, the calculated field for total earning will have an erroneous. This has been illustrated below.
Respondent | Number of Days of Work | Average Daily Earning | Total Earnings | Status |
A | 21 | 500 | 10500 | |
B | 15 | -777 | -11655 | Flag |
C | -777 | -777 | 603729 | Flag |
In a survey, there are cases wherein personal opinions are recorded. They can correspond to perceptions about an issue or just reasons for non-availability or refusal. These opinions will, most of the time, be recorded in the local language of the respondent or will be approximate translations posted by the enumerator. The appropriate method to deal with such inconsistencies is to take a note of the target users of the dataset and then use appropriate translations for the same. I recommend writing the translated answers in another new column next to the original entry to maintain the authenticity of the data collection exercise. To quote an example, the entry “pair mein dard” may be translated to “pain in legs” (in another column) for the question asking what diseases the respondent is currently suffering from.
There is a very thin line between data cleaning and data analysis. While one may perceive replacements to be a function that is performed by a data cleaner, the reality is that a data cleaner ensures that the data is consistent and of good quality and is in a ready to use state for the analysis team. Replacement for missing data or outlier values in the dataset are functions that are performed in tandem with the analysis of the dataset. This ensures that the replacements are suitable for the purpose of the study.
Recommendations for STATA users
Users of STATA know how easy it is to perform basic checks on the dataset. The commands tabulate, summarise and duplicate, when combined with conditions come in handy for any kind of database. To illustrate, out of 505 respondents, a few consented to the survey and a few did not. In order to see the number of respondents who consented to the survey divided between males and females, the following command tabulate may be used. Here, 1 for consent corresponds to “yes”.
The summarise command is helpful when you want to look at descriptive statistics (average, range, standard deviation etc.) for a numeric variable such as rainfall, age, income, cholesterol level and so on. This command also detects outlier entries in the variable.
The duplicate command can be used to list and tag duplicate entries for any variable. The tagging exercise involves the generation of a new variable that takes the value 1 if the observation has one duplicate, 2 if the observation has two duplicates and so on, and takes the value 0 if the observation has no duplicates. The generation of this variable is beneficial for identifying, ordering and studying the duplicate values in the dataset.
To list duplicates for a variable use: duplicates list variabe_name
To tag duplicates for a variable use: duplicates tag variable_name, generate(new_variable)
Use the generate command to create dummies wherever possible. Dummy variables can be useful when one wants to apply multiple conditions on one or more variables. For example, we want to understand the newspaper reading habits of males who are over 25 years of age, with higher education, who live in state A. We will start by generating a dummy variable to identify these respondents in the dataset by using the following set of commands. For gender, 1 corresponds to male, and for education (edu), 4 corresponds to higher education.
generate a = 1 if gender == 1 & state == “A” & edu == 4 & age >25
tabulate newspaper_var if a == 1
The first step tags the observations for which all of the conditions are satisfied. The second step lists out the responses of the variable for the identified group of individuals. When carrying out your analysis, we recommend using the two-step approach of identification and rectification listed out for duplicate values, as it is vital to examine the nature of errors in the dataset before proceeding with the rectification exercise.
Automating the cleaning process by creating do-files that can be replicated for a small section of the master database can make our lives a lot easier, and the data cleaning exercise more fun. Remember that writing STATA commands is like writing sentences but in STATA’s language. It is advisable to keep your commands as simple and your do file as explanatory as possible.
Conclusion
Notwithstanding how exciting one may find data cleaning to be, the best way to clean a dataset is to minimise the possibility of receiving incorrect, irrelevant or missing data. As an agency that collects data from the ground, we make sure to make our surveys as foolproof as possible, and we train the enumerators to collect quality data. Moreover, the data cleaning exercise complements data collection and monitoring. For instance, for a survey that would span a few months, initial sets of data received from the field can shed light on where the data is subpar and also let us know the kind and the extent of errors the enumerators are making. Such monitoring will allow for early detection and speedy action to amend further data collection.
With an ever-growing dependence on data for policy-making, there is an immediate requirement to standardise the protocols for cleaning and maintaining databases. This series is a small step in that direction.
Ashmika Gouchwal is a Quantitative Researcher at Outline India. Himanshi Sharma is a Research Associate at Outline India.
 Outlineindia
- 12 October, 2023
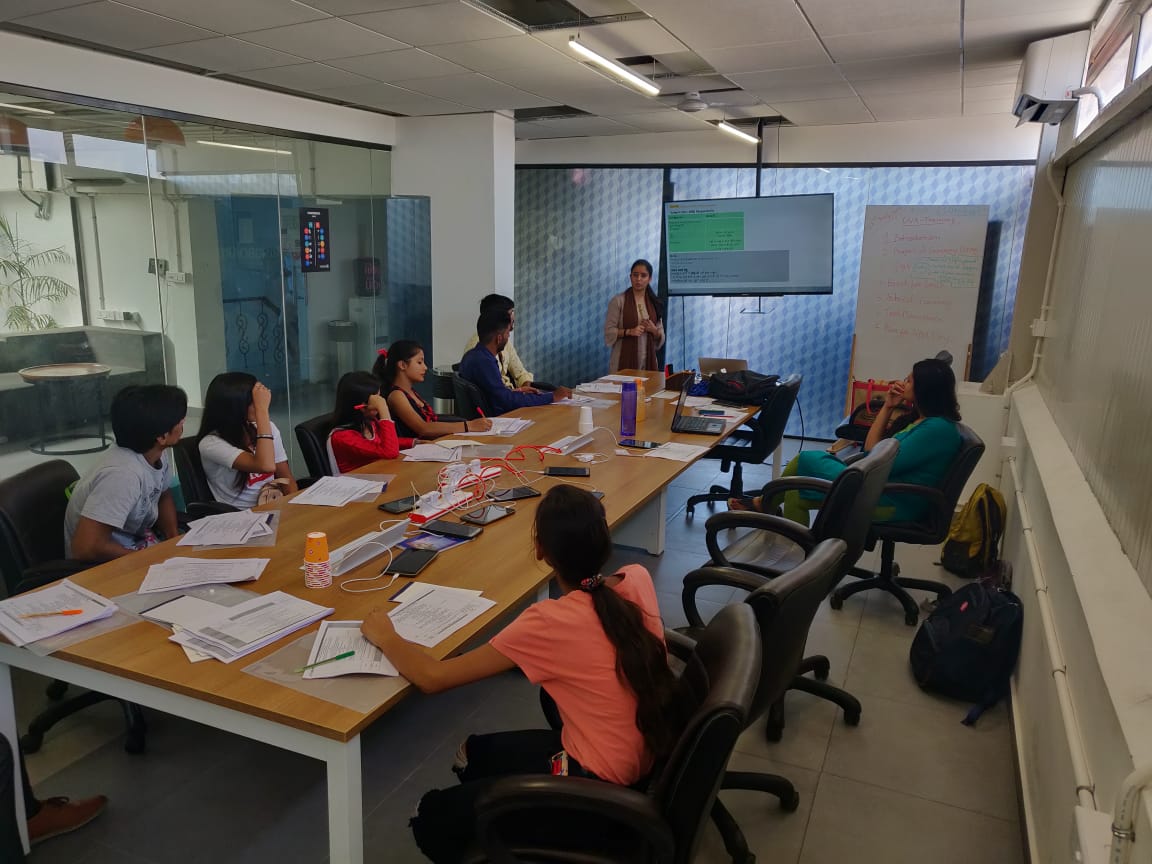
HOW TO CONDUCT FIELD TRAINING
 Outlineindia
- 12 October, 2023
URBAN PLANNING AND THE SLUMS IN DELHI
The journey from a refugee colony to a global city
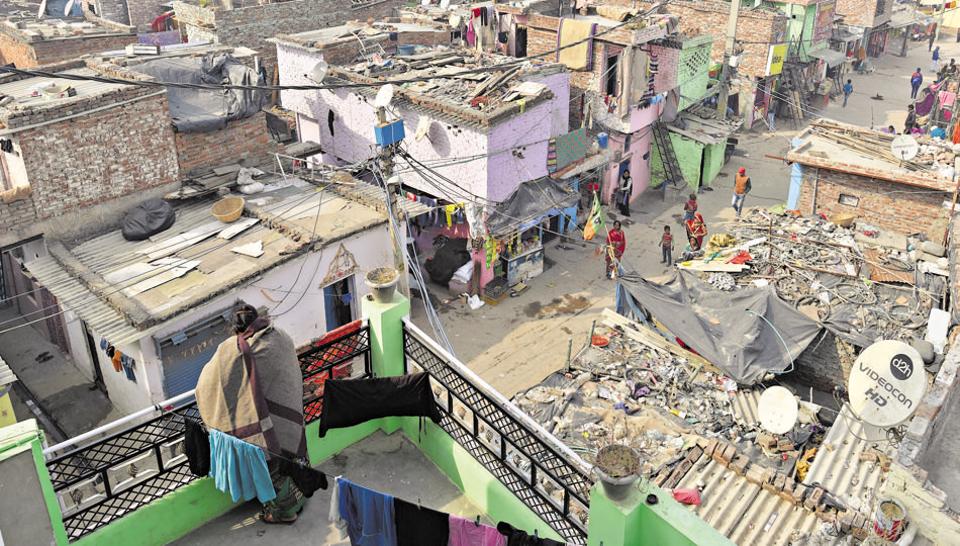
Lying, on the banks of the ancient river Yamuna, New Delhi is one of the fastest-growing urban agglomerations in the world and is the seat of power for the Indian government[1]. Hence, Delhi has witnessed a meteoric rise in population from the 1965s to the contemporary era. Delhi played as an important refugee settlement post-partition. This led to the creation of the first master plan which sought to rehabilitate the refugee families into different spaces. These turned the earliest fusions of present day authorized housing colonies of post-partition Delhi and the contemporary city that we know of today. Authorization of colonies and access to state services has played a crucial role in the lives of the residents of Delhi. The fact that an inhabitant was able to get access to public services was a significant step for that person to lay claim as the citizen of this city. The laws around claiming residency and citizenship have changed and played a vital role in shaping the spatial development of Delhi.
The first master plan of Delhi legitimized the refugee resident colonies and demarcated areas for official spaces and paved the way for future residential projects. A significant move was to shift hazardous chemical-based factories to the fringes of the city which were then further pushed to areas such as Bawana, Mongolpuri and Mayapuri to name a few. As industrial areas burgeoned a significant population of workers who resided in slums had to move closer to the factories. This played into a shrewdly developed move to legitimately clear out slum areas out of the city space to the peripheries. This process actually highlights the ambivalent nature of the city comes to the fore as the populace not deemed fit to be a part of it.
Unauthorized colonies, slum areas and Jhuggi Jhopri clusters have been as much a part of Delhi as the regularized colonies. They serve as residences for immigrant populations who come from different parts of the country in hope to find employment and perhaps in search of a better quality of life. The people in these slums and JJ clusters are part of the humongous informal sector providing vital ancillary tasks for the cities, employed often as maids, housekeepers and helpers in various commercial and residential spaces.
Fast forward to 2019, Delhi has been built on two significant master plans which have focused on rapid infrastructural development further pushed by its increased visibility on the global stage towards the last decade of the previous century, with the advent of the liberalization, privatization and globalization era the city of Delhi was vying for the spot as a global city. It is with that goal in focus that the current master plan of 2021 aims to change the landscape of this city, into a slum-free city. This decision jeopardizes the lives of around 1.4 million people still living in such settlements and their fate is in a state of limbo, without a tangible solution in sight.
The Slum dweller in an ambivalent city environment and the right to the city
The slum in the context of Delhi has been defined with very specific parameters, in fact, a slum has more legitimacy than a jhuggi jhopri camp (squatter settlement), often in a slum area there will be land which will be designated as a Jhuggi Jhopri camp, and it is this particular area that we will focus on because regardless of the state and private bodies vying to gain control over the slum areas, the judiciary stepped in to give rights to the slum dwellers, this, however, does not include the people who stay in Jhuggi Jhopri clusters.
Majboor Basti JJ camp is located in Mandawali-Fazalpur colony in the eastern part of Delhi. The residents here highlight the problems of access and acceptance that is commonly witnessed in areas where Jhuggi Jhopri camps are prominent in Delhi. Interestingly, the electricity line that was made permanent due to the entry of a private sector power company which in order to maintain business has provided nearly all areas with a permanent connection, regardless of the status of registry of the houses. This may seem like a step up for all the residents in the JJ camp however it does little to prevent the state from exercising its right to remove and re-locate them at no moment’s notice.
The significant chunk of the residents of Majboor Basti is home to third-generation inhabitants who were born and raised in Delhi, however, in this city environment, they are still alien residents not part of the city space, rather the gentrified population in the gated colonies and authorized colony spaces often see these jhuggis to be a hot-spot of crime and nuisance, unhygienic conditions, and a cesspool of diseases. Enforcement agencies patrol these locations and often complaints related to theft, are traced back to these areas. With the aim to be a truly global city, how do we address the issues aforementioned and find a co-creative space.
Moving away from Aesthetics
City planners in their grand blueprint of the master plan 2021 have tried effectively to give Delhi a makeover, at least aesthetically. The notion of a slum-free city also stems from the desire of both public and private sector real estate developers, who see these slums and JJ clusters to be land that has been illegally encroached by unlawful means, without highlighting the fact of the true profits that they hope to gain by removing these people from the places where multiple generations have resided albeit under a constant threat of eviction. Perhaps this is part of the reason why the jhuggi residents have never taken ownership of the space that they stay in, because they know that it has become impossible for them to exercise any right or control in the situation of their residential status.
The way forward constitutes re-designing of the master plan by moving away from the need of superficial aesthetical model[2]. Participation can be a key tool to facilitate development in the city, participatory processes can be made inclusive by ensuring equal representation from different areas. It may not be an end to the spatial problem rather it will lay the foundation to an inclusive process in the legislature by ensuring that the “illegitimate population” of the city has a greater say in decisions concerning their lives. The population in the unauthorized areas/JJ clusters/ have and still are actively playing a huge role in making Delhi a diverse place and giving these populations rights to be a part of the decision-making process may ensure afar greater ownership and security, which will be the first true step of transitioning into a global city.
[1] Major Agglomerations of the World - statistics and charts in maps, diagrams and tables. (n.d.). Retrieved from http://citypopulation.de/world/Agglomerations.html
[2] Ghertner, D. A. (2015). RULE BY AESTHETICS: WORLD-CLASS CITY MAKING IN DELHI. New York: Oxford University Press.
 Outlineindia
- 12 October, 2023
'KASHMIR' THROUGH THE LENS OF HALF-WIDOWS
“Gar firdaus bar-rue zamin ast, hami asto, hamin asto, hamin ast.” (If there is a heaven on earth, it's here, it's here, it’s here…)
The above phrase of Amir Khusrao often resonates and reminds one of the picturesque beauties of Kashmir alluring ardent travellers to visit this ‘abode of God’. As a young solivagant researcher, who reveals herself in the act of wandering alone in destinations and locations she has not previously visited. I felt a sudden frisson of excitement and thrill post my field induction site was finalised as Kashmir.
Chilla-i-Kalan[1] embraced me as soon as I reached Srinagar. The valley had turned into an unbelievable dream, covered in a blanket of snow. I was welcomed or ‘Khatir madarat’ as Khala would say, by partially frozen pine trees and snow-clad peaks in the backdrop of Lal Chowk.
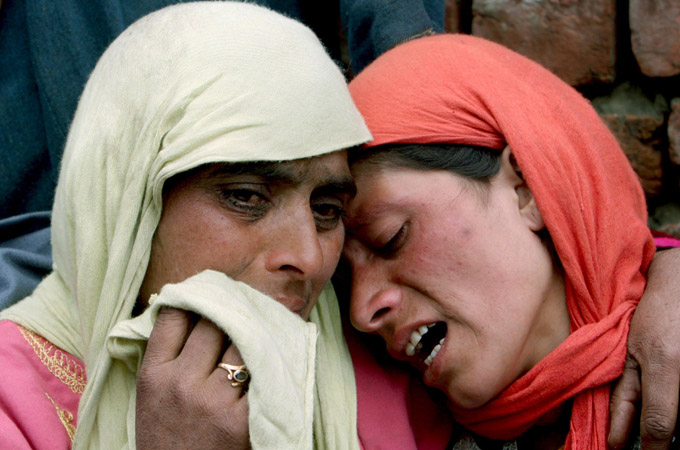
Post reaching ‘home’ for the next two months, Khala (the mother of a dear friend with whom I stayed in Kashmir) quickly gave me a hot water bottle and Kanger[2] to fight this cold. Mesmerised as I was by the snow-capped peaks of the Himalayas at a distance, I couldn’t help but notice a group of people largely women, sitting on the road with placards and pictures of ‘men’. On enquiring I learnt that these women took part in sit-ins every month in Srinagar to seek the whereabouts of their loved ones who were subject to enforced disappearance. Enforced disappearance is a phenomenon where a person is secretly abducted or imprisoned by a STATE or POLITICAL ORGANIZATION, or by a third party with the authorization, support, or acquiescence of a state or political organization, followed by a refusal to acknowledge the person's fate and whereabouts, with the intent of placing the victim outside the protection of the law.
The picturesque Kashmir Valley often acclaimed as the paradise on Earth has witnessed the death of more than 90,000 people and the disappearance of 8,000 people in the last thirty years. Of which a little more than 1,500 people who disappeared were married. Hence, it is not wrong to assume that at least 1,500 ‘half widows’ or ‘half wives’ have been residing in the valley sans 1989.
 Outlineindia
- 12 October, 2023
